Building Waymarked: From Idea to Printed Maps in 24 Days
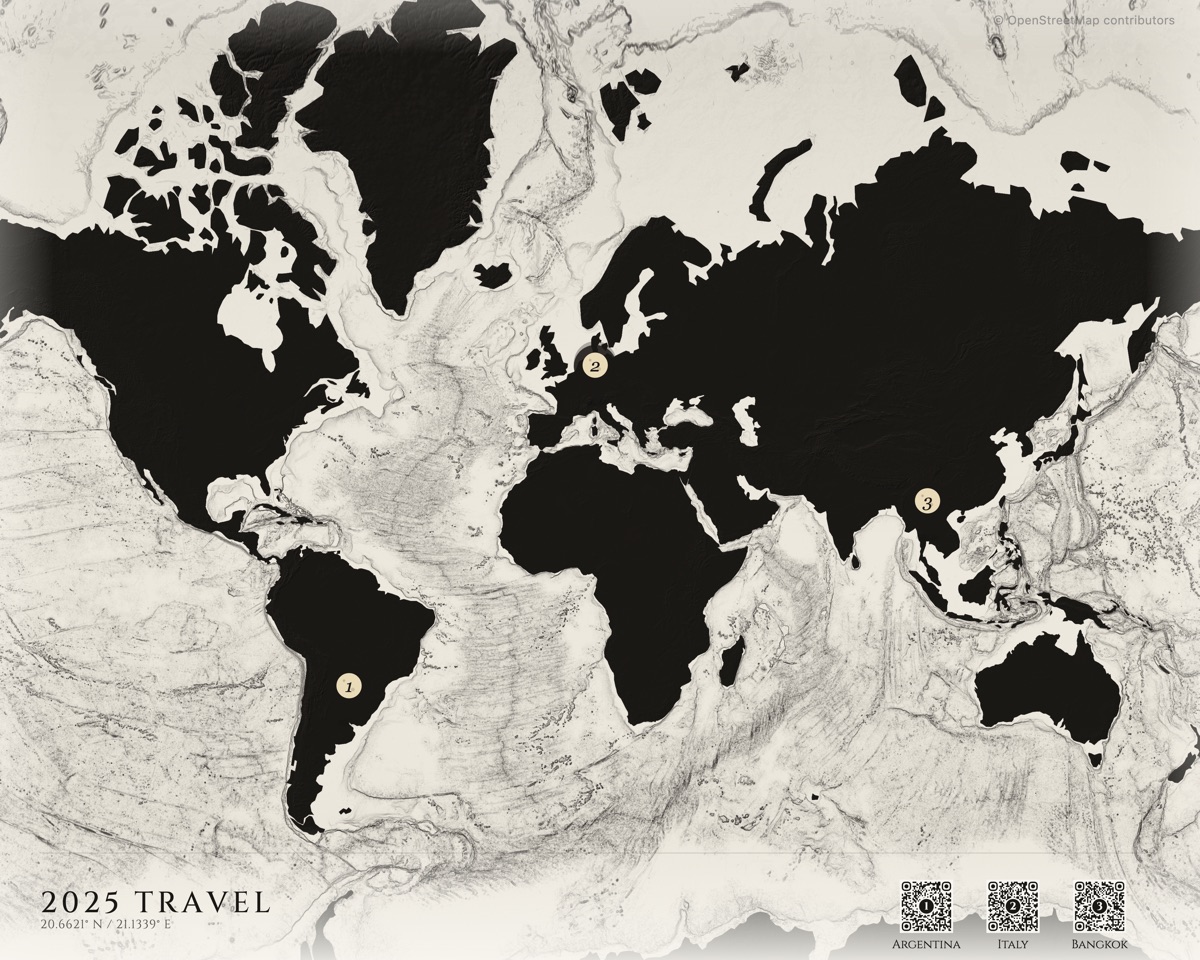
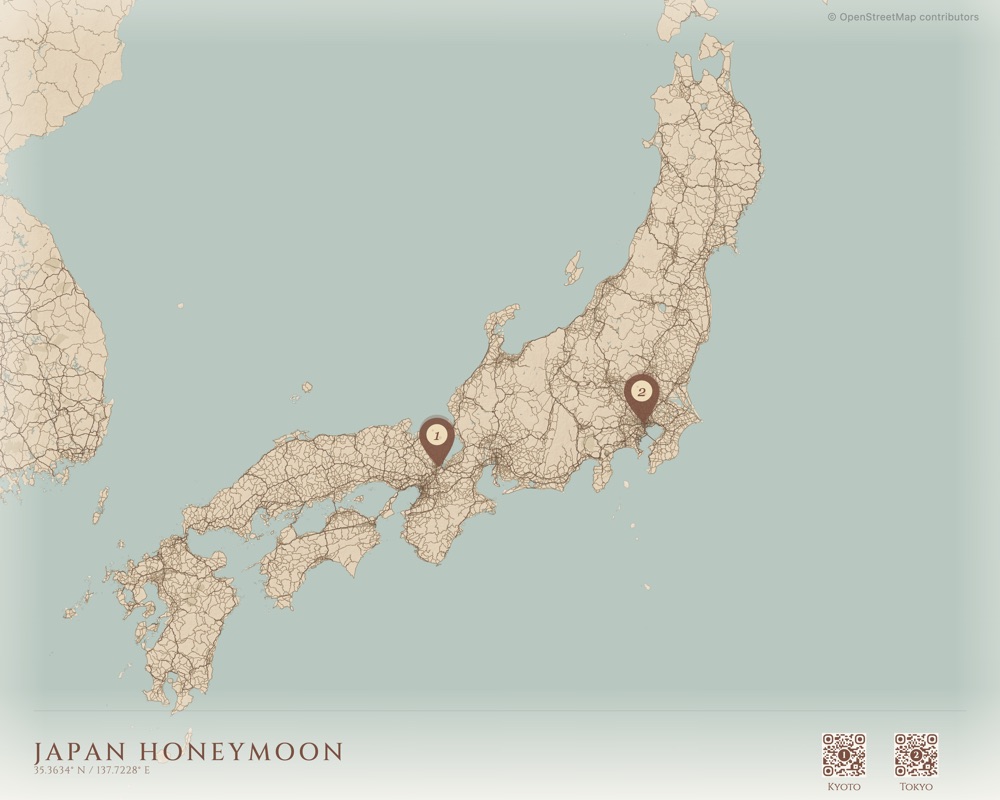
I shipped Waymarked in 24 days. From an empty repo on December 30th to a shipped product on January 22nd. A product that takes your vacation photos, extracts GPS coordinates, clusters them into locations on a vintage-styled map, and drop-ships a framed print to your door.
This is the story of building it — and how I built almost all of it with Claude Code.
But the idea started three years earlier.
Day Zero
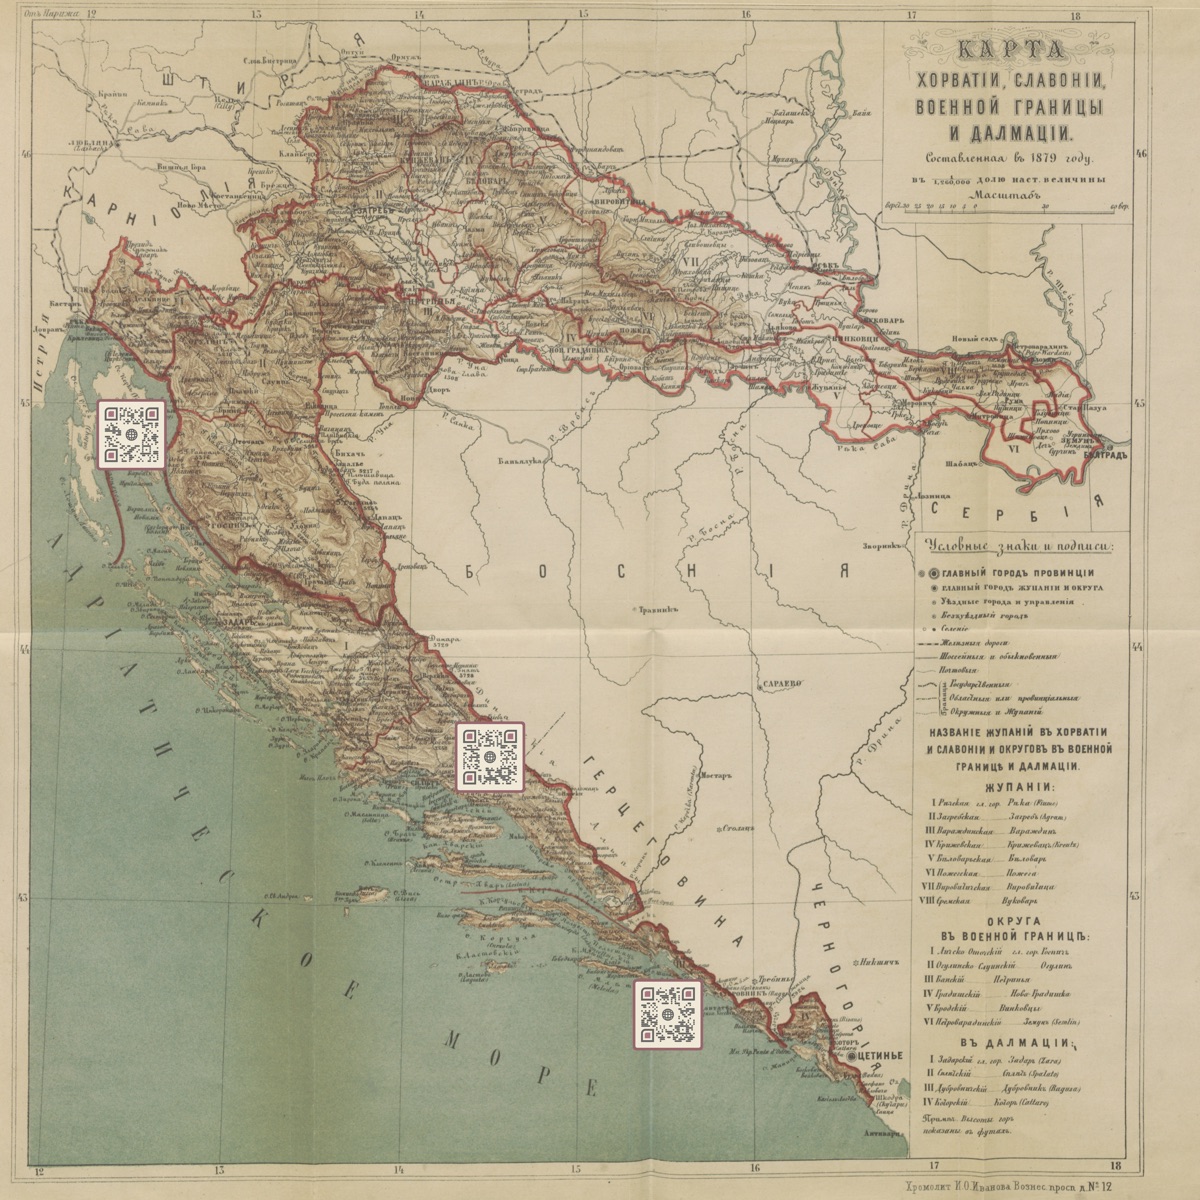
In 2022, my girlfriend and I went to Croatia. Afterward I wanted to make her something — not a photo book, something different. I had this idea for a map with QR codes that linked to photos from each place we visited. I generated the QR codes on some free website, opened Photoshop, and manually placed them onto a nice map of Croatia. Framed it. She loved it.
Then my mom and I went on a family trip to Peru. Same thing — Photoshop, QR codes, a printed map. She loved it too.
Fast forward to late 2025. I’d just gotten back from South Africa on December 29th. By this point I’d been using AI coding tools heavily — Opus 4.5 with Kiro CLI at Amazon, Claude Code on side projects — and something clicked — I’d now made this same gift several times by hand. Why not build it into a product?
The next morning I opened my laptop and started writing code.
Day One: Two Commits, One Editor
December 30th, 2025. The first commit landed at 12,594 lines. Database schema, landing page, geo utilities, map themes. The second commit — same day — added the interactive editor and photo clustering.
I barely wrote any of it by hand. Claude Code generated the vast majority of the codebase — I steered it with skills, prompts, and architectural decisions. The technical expertise isn’t in typing the code, it’s in knowing what to build, how to structure it, and when the AI is going down the wrong path. I made the data model choices. I decided the entire map rendering configuration should live in a single JSONB column called mapSpec so the relational tables stay clean and adding a new visual option means updating one JSON blob, not altering schemas. Claude wrote the implementation. I directed the architecture.
Learning to Make Maps
I knew nothing about cartography when I started. I learned that beautiful maps are built from layers, and each layer is its own rabbit hole.
The tile system is built on PMTiles — a single-file format for vector tiles that supports HTTP range requests. Instead of running a tile server or rasterizing the world, I downloaded the entire planet’s vector data as one .pmtiles file and hosted it on Cloudflare R2. When MapLibre needs tiles for a region, a custom protocol handler translates the request into an HTTP range request against that single file. No tile server, no per-request compute. Just a CDN serving byte ranges.
On top of the vector data, terrain comes from AWS elevation tiles rendered as hillshade. The exaggeration varies by style — dramatic relief maps crank it to 1.0, subtle coastal styles drop it to 0.25.
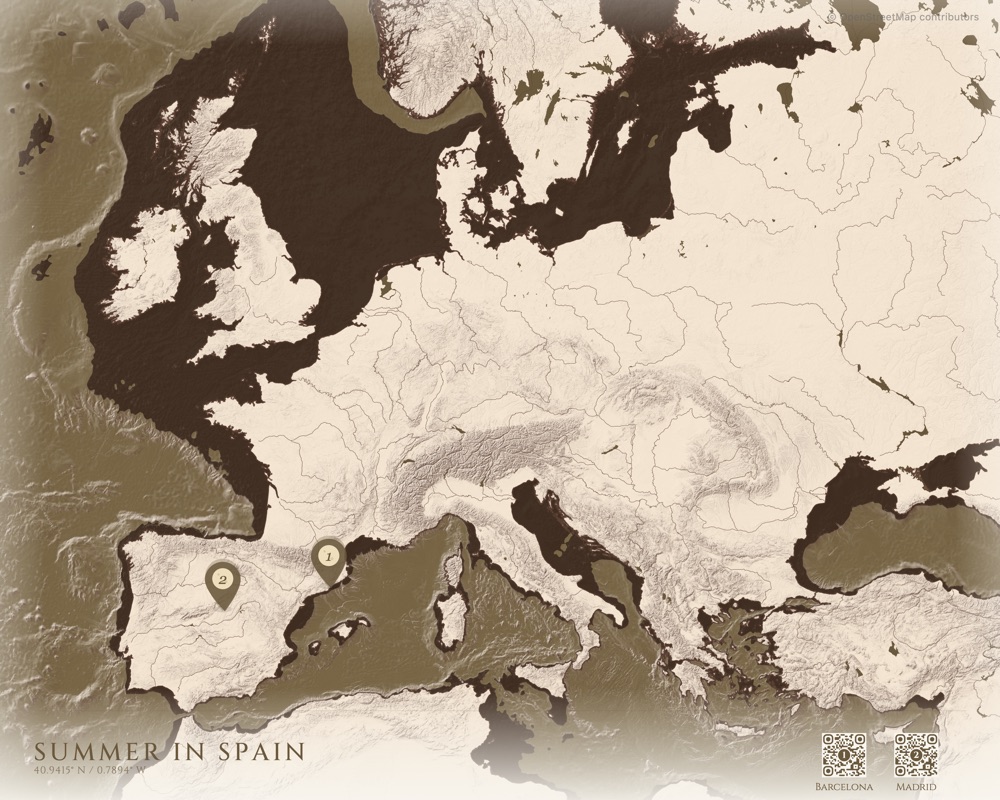
The rabbit hole I didn’t expect was bathymetry. The sketch-style maps use six layers of Natural Earth ocean depth data at different intervals — 200m, 2000m, 4000m, 6000m, 8000m, 10000m. Each layer renders as a progressively lighter fill, creating a depth gradient in the ocean. A subtle contour line at the 200m mark traces the continental shelf. Stacking these layers with the right opacity creates the illusion of ocean depth that makes the maps feel alive.
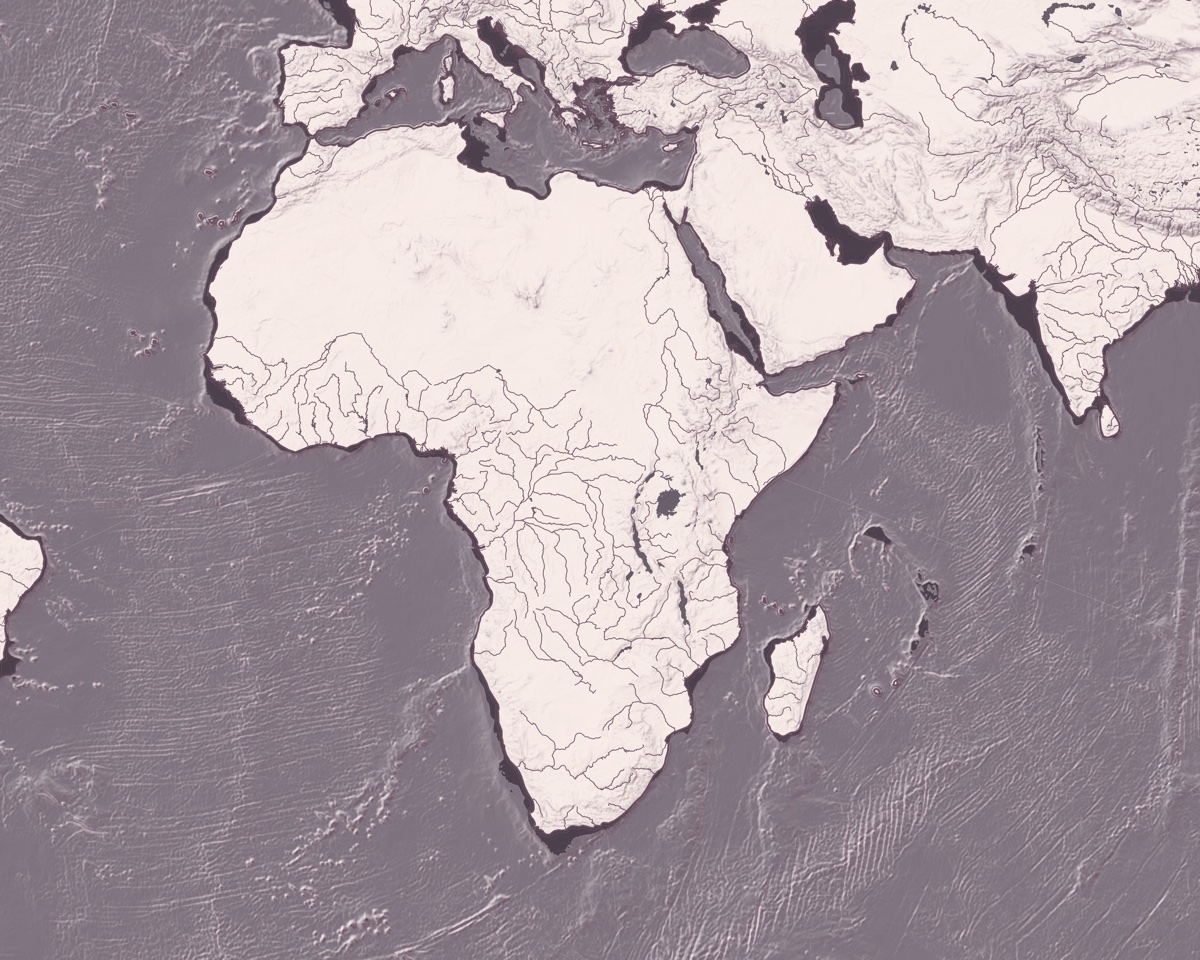
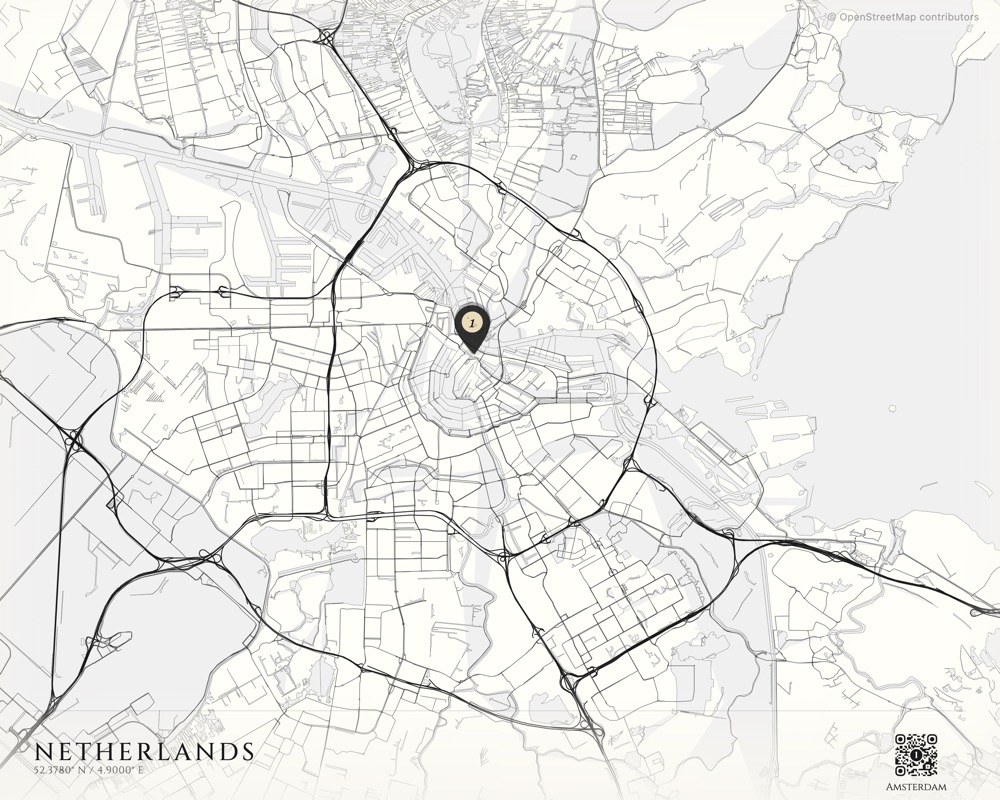
28 styles across four families: Classic vintage cartography, terrain-only relief maps, contemporary clean aesthetics, and hand-drawn sketch styles with bathymetry. Each one is a full MapLibre GL style specification — colors, fonts, line widths, label rules, layer ordering. Building these taught me more about visual design than any course could.
When Mobile Broke Everything
The original plan rendered the map client-side. Desktop browsers handled it fine. Mobile browsers crashed trying to capture a high-resolution canvas — the kind of resolution you need for a poster print.
The fix was a Lambda consuming from an SQS queue. But not a small Lambda. Rendering maps in a headless browser turned out to be brutally hard. The Lambda runs a Docker container with Chrome for Testing and SwiftShader for software-based WebGL — 10GB of RAM, up to 15 minutes of execution time. It loads the same React editor component that runs in the browser, navigates Puppeteer to a render page, waits for a window.__RENDER_READY__ signal, then captures the canvas.
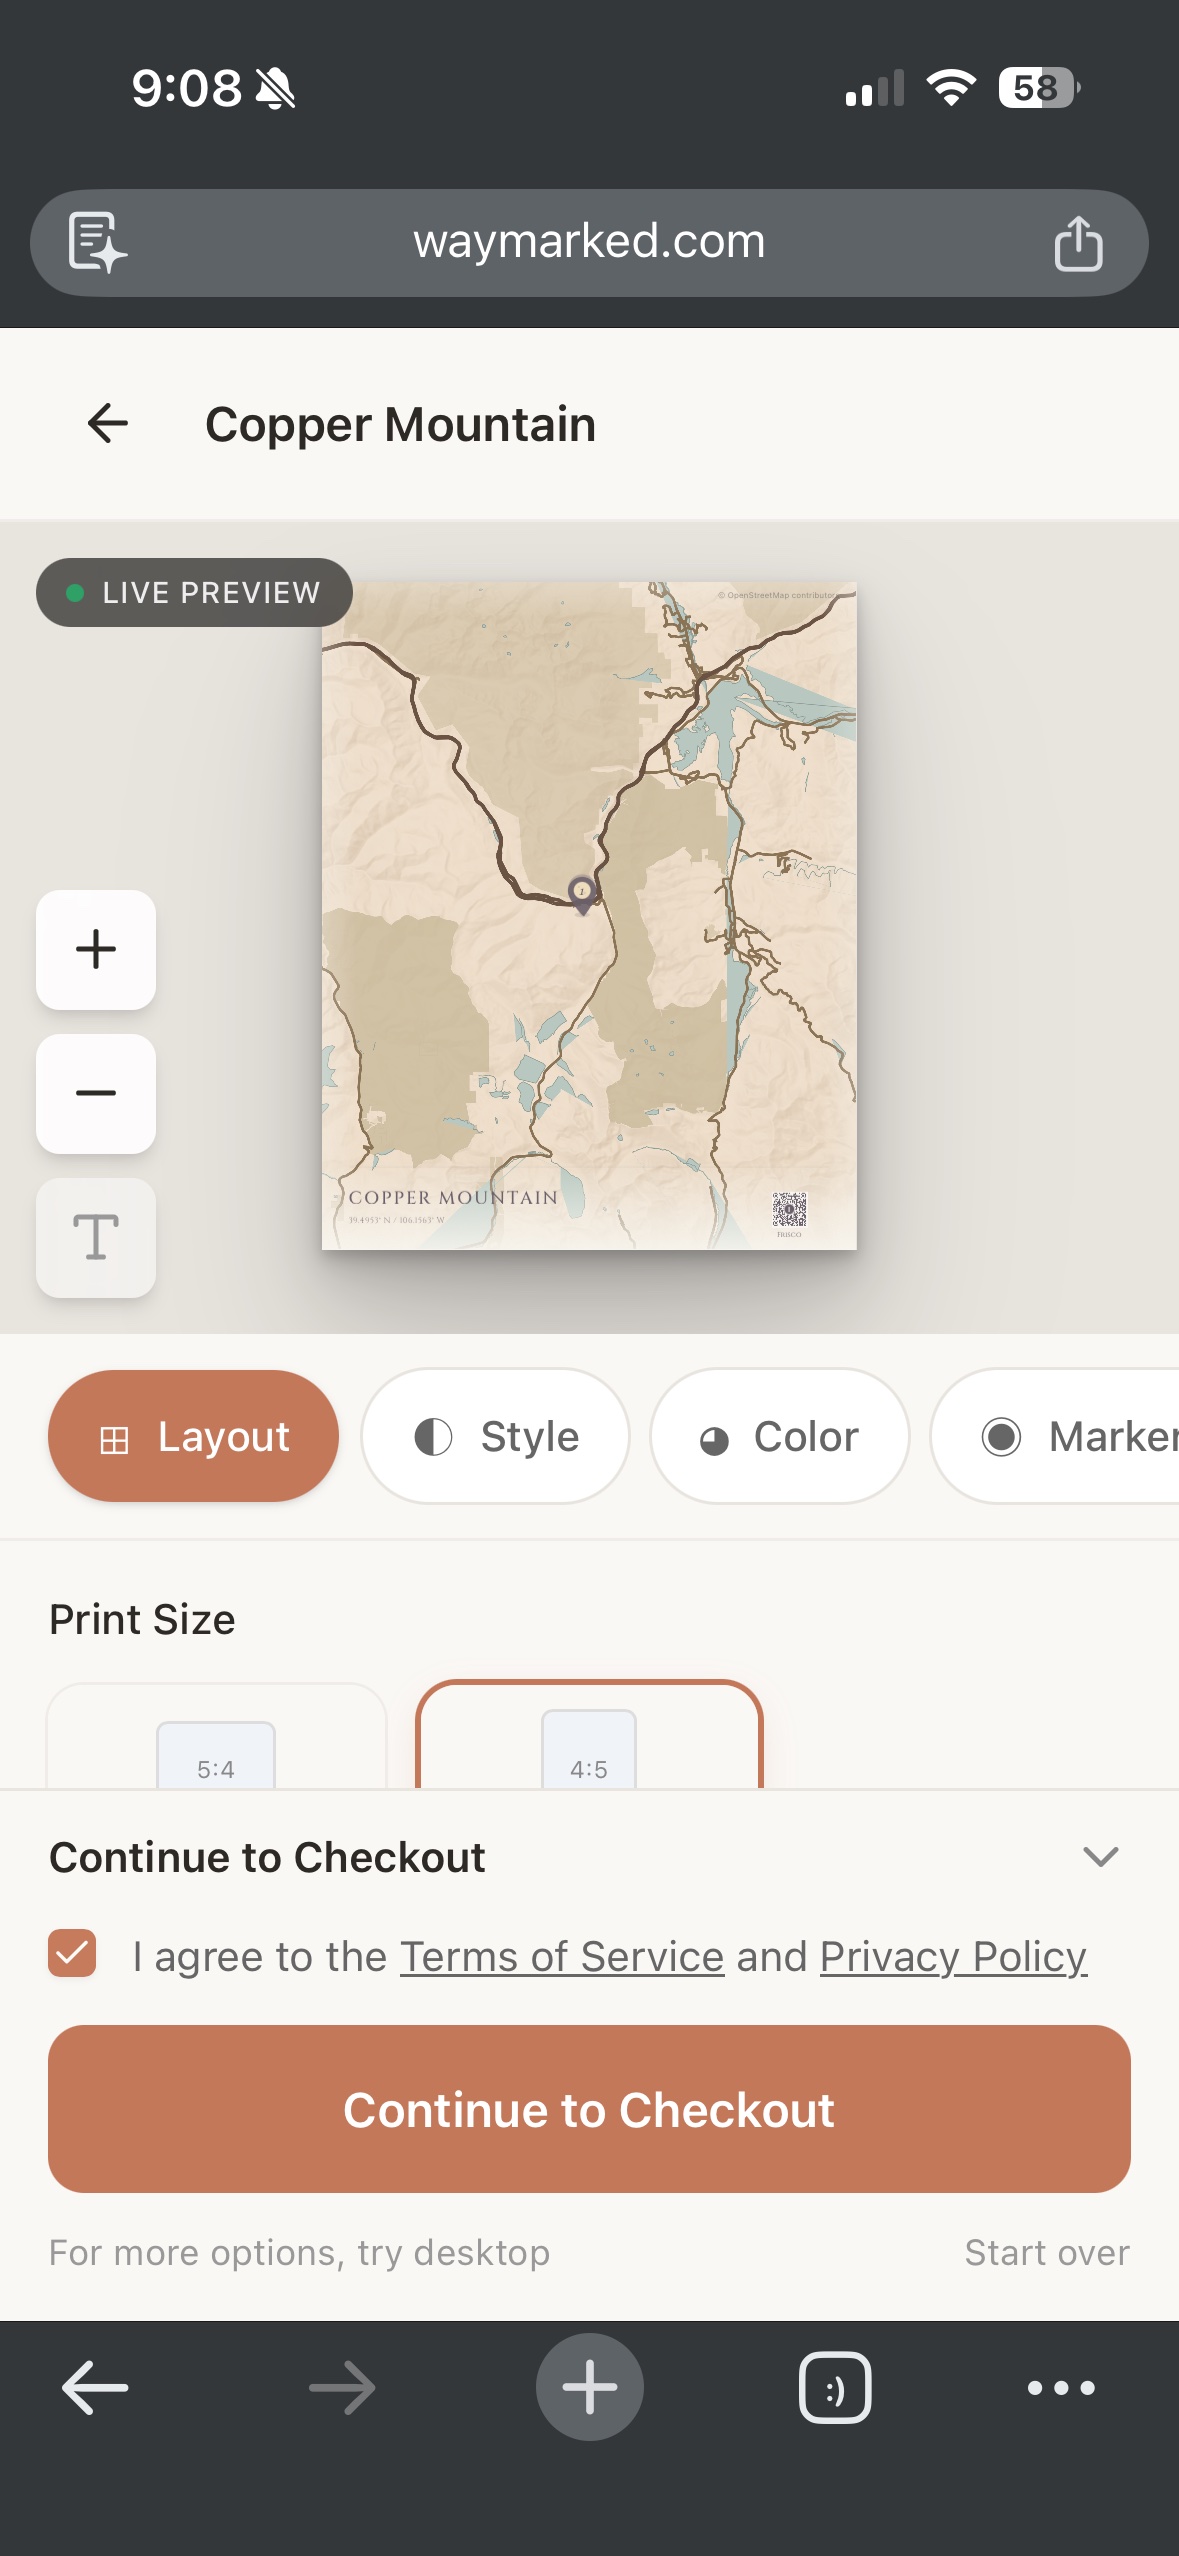
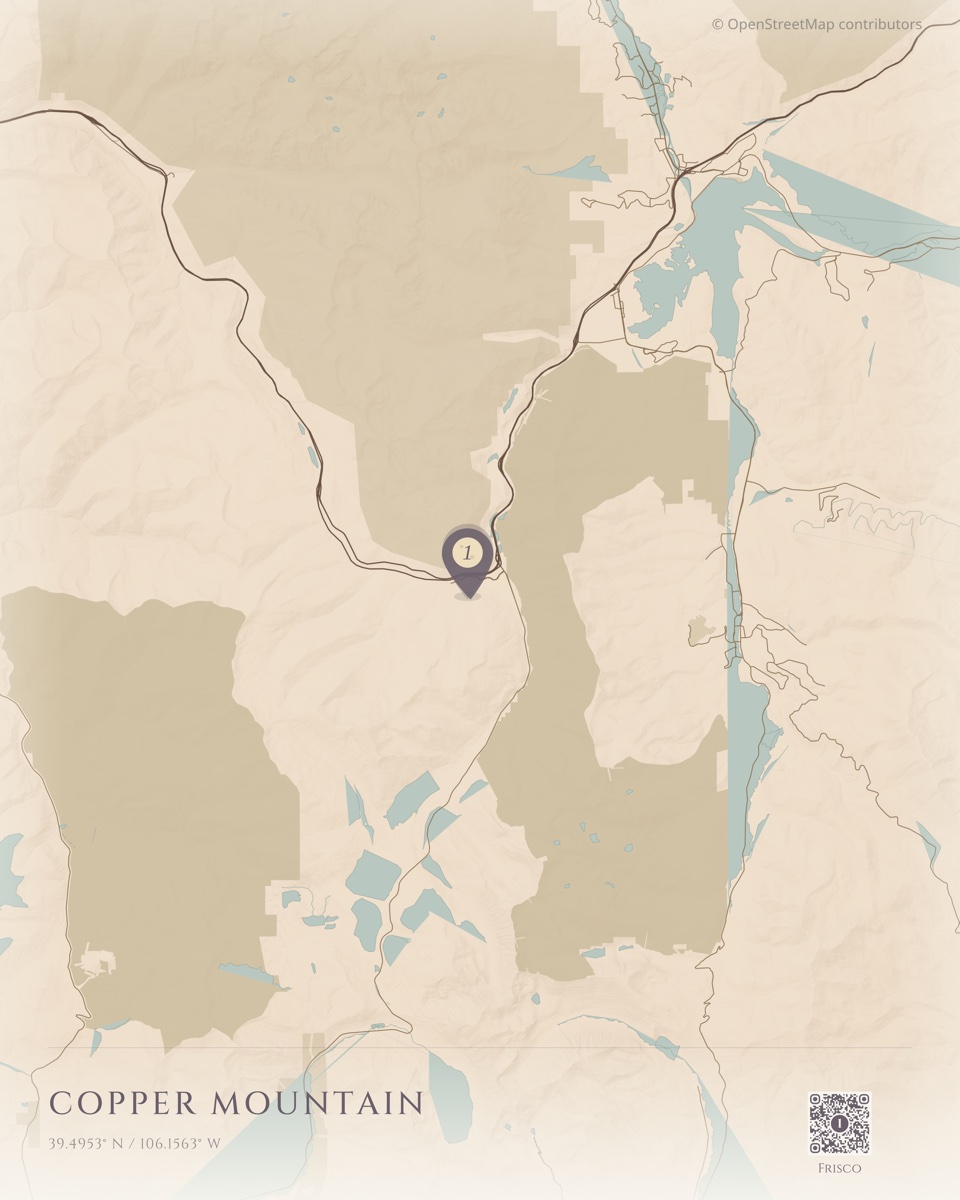
The thing I’m most proud of is the MapSpec pipeline. When a user on mobile goes to checkout, I freeze the entire map state into a resolved JSON blob — every marker position, viewport center, zoom level, style choice, QR code placement — and store it in Supabase as JSONB. The Lambda then hits a dummy page on the Next.js site that pulls that spec from the database and recreates the exact same map the user built on their phone. Same component, same state, pixel-for-pixel. Getting that reconstruction to work reliably took days of debugging.
From there it’s two-phase rendering. I optimistically queue a preview render. The Lambda renders an HD image (1200px wide) in about 45 seconds. The user sees their map preview while browsing checkout options.
When they actually pay, the Lambda renders the full print-quality image — 7200x4800 pixels for a 24x16” poster at 300 DPI. This takes up to 7 minutes. The user gets an email when it’s ready.
The math for making this work was the hardest part. The preview renders MapLibre at an internal resolution of around 2000 pixels:
previewWidth = canvasWidth × displayScale × detailScaleThe export needs to show the exact same geographic area at 7200 pixels. The zoom adjustment:
exportZoom = previewZoom + log₂(exportWidth / previewWidth)Text and line widths scale to maintain visual proportion:
scaleFactor = effectiveScale / (displayScale × detailScale)Get any of this wrong and the printed map doesn’t match what the user saw in the editor. I struggled with this for a while before the math clicked.
Physical Products Without a Warehouse
Printful handles printing and fulfillment. After Stripe confirms payment, the rendered map image URL and a shipping address go to Printful’s API. They print, pack, and ship.
The dual-webhook architecture keeps payment and fulfillment cleanly separated. Stripe webhooks handle money. Printful webhooks track the physical lifecycle: created, printing, shipped with tracking, delivered. Each event updates the order state and triggers notification emails.
I never touch inventory. I never see a package. The product goes from Printful’s printer directly to the customer’s door.
Photos live on Cloudflare R2. A daily cron job deletes any uploads that weren’t paid for, so storage doesn’t bloat. Right now the whole thing runs on free tiers — Supabase free, R2 free under 10GB, Vercel hobby.
The unit economics work out cleanly. A 7-minute render on a 10GB Lambda costs about $0.07. Desktop users render client-side, so digital orders from desktop are essentially free. A poster sells for $25 and costs $12 through Printful — roughly $13 margin. A framed print sells for $49 and costs $35 — about $14 margin. The infrastructure cost per order is negligible next to the fulfillment cost.
”go live baby”
January 20th. One file changed. 107 lines deleted, 21 added.
The waitlist page — a client component with email capture, loading states, error handling — replaced with a server component importing pre-built landing sections. The landing components had been built in a previous commit. This was just flipping the switch.
Two days later everything was stable. Twenty-four days from first commit to a finished product.
Now the hard part: getting it in front of people. I built a WhatsApp-to-Claude Code bridge to automate SEO and marketing from my phone. That’s a whole other story.